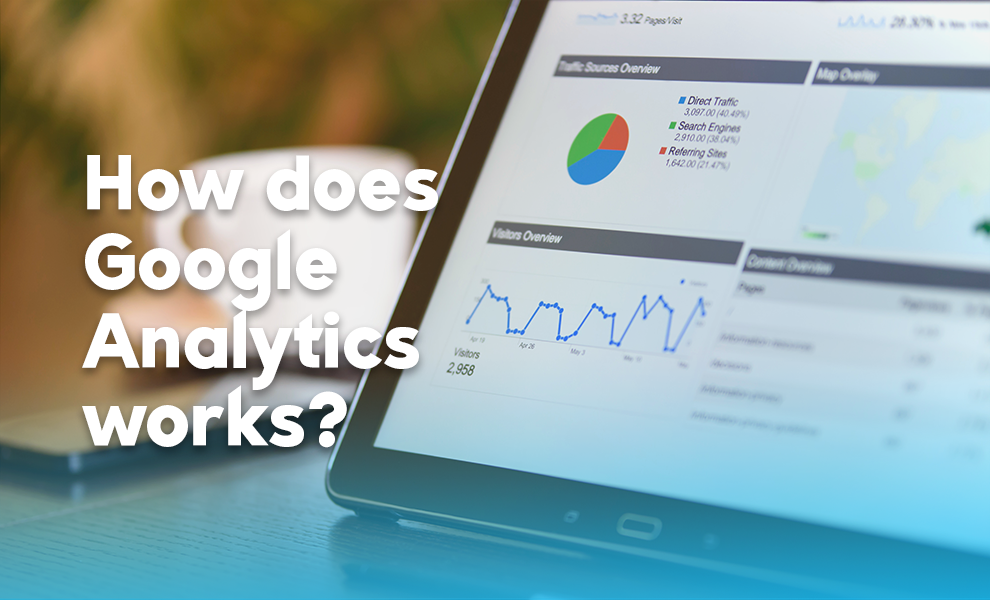
How Does Google Analytics Works?
Alejandra | May 15, 2022
This term may sound very complex to a lot of people…and we understand that.
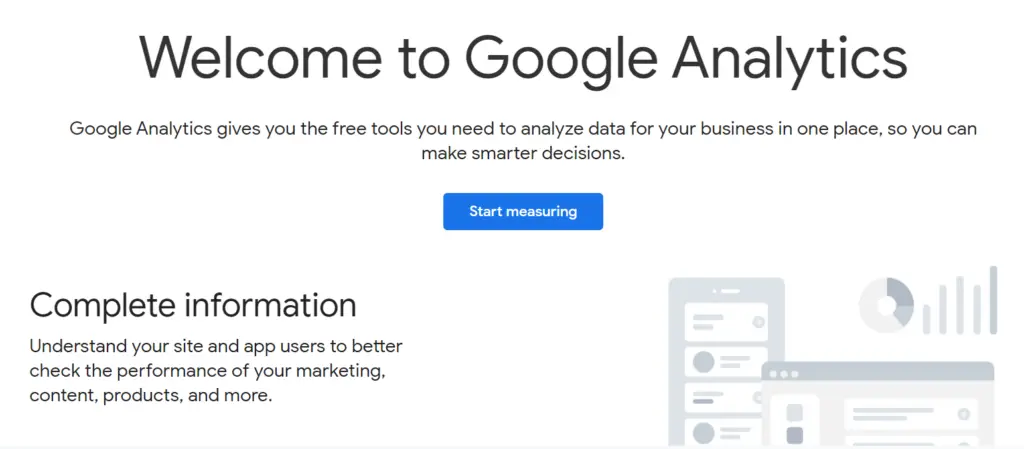
So let’s first break it down to its simple definition. Google Analytics is part of the Google Marketing Platform, and anyone with a Google account has access to it.
With these analytics, you’re able to track the ins and outs of your website’s performance. It presents you with various statistics, charts, and all kinds of tools for marketing purposes.
It’s often used by small to medium-sized businesses. You can also think of this as customer behavior analytics.
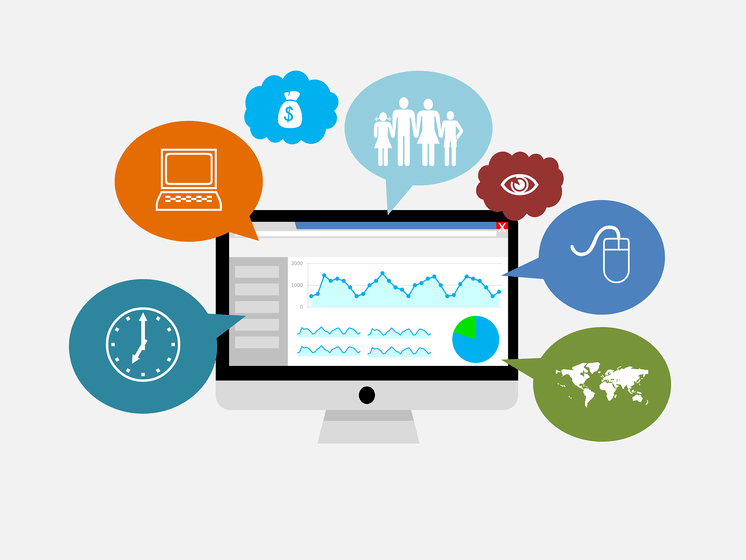
It’s very useful because you, as a business owner, would be able to track patterns in consumer engagements, see visitor demographics, and even analyze the effectiveness of your marketing campaigns.
Now, you’re pretty much aware of its purpose, but how exactly would you start using it?
In this blog, we’ll give you a brief introduction to just that. You’ll learn about some of its features, how they function, and how to gradually get the hang of it.
Don’t worry, it won’t be too heavy. We’ll take it part by part. Let’s get started!
Well, first things first…
You’ve got to set up your account through the Google Analytics Website.
After that, you can add Google Analytics to any kind of website to track your visitors’ behavior.
To do this, you have to install a tracking code. This signals Google Analytics that it has to track the performance of that certain website and it’s usually done by using a JavaScript page tag.
This is the certain tag that will run through the web browser of each visitor to collect their demographics and activity on your website.
With this, you can track so many metrics. Let’s list some down and define each:
- Bounce Rate: Percentage of visitors who view only a single page.
- Sessions: A group of visitor interactions that happen within a 30-minute window of activity.
- Average Session Duration: How long each visitor stays on the website (on average).
- Percentage of New Sessions: The percentage of first-time visits.
- Goal Completions: These are also known as conversions. It’s the number of times a visitor completes a desired action, like making a purchase on the website.
You may want to read this blog next: 3 Frequenty Asked Questions About SEO
Now, let’s go through some major features!
The main features of Google Analytics allow for data collection, analysis, visualization, monitoring, and even creating custom reports for specific metrics.
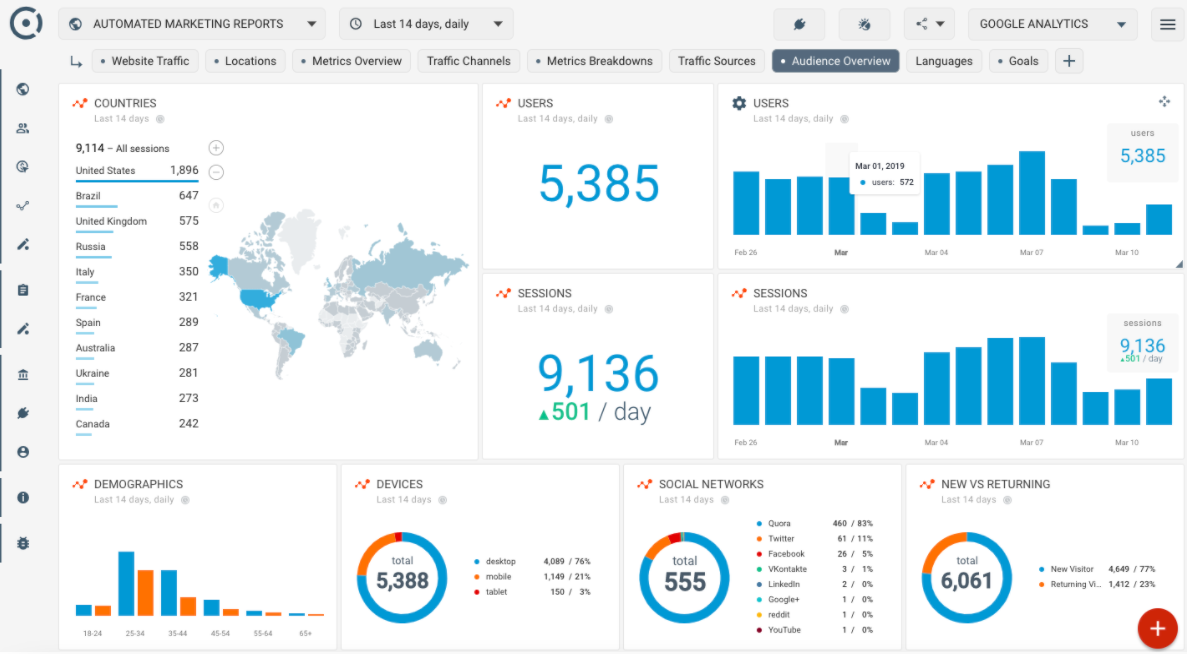
Your Google Analytics Dashboard is where you can display your own custom metrics to constantly track what you aim to focus on.
It’s so versatile that you can even integrate your analytics to other applications, such as Googe Ads, Google Optimize 360, Sales Force Marketing Cloud, and a lot more!
And below your Dashboard customization feature (left-hand side), you’ll notice 5 main reporting options:

We’ll give you a brief overview of how they work.
- Real-Time Report: This shows the number of users on your website at that specific moment of checking. It’s an effective report for seeing the performance of a new campaign you’re running, like a sale or giveaway.
- Audience Report: This type of report focuses on the categories under your website traffic. It breaks down your visitor’s demographics. Under this, you can see their geo report (location) and even what device they’re using to access your site.
- Acquisition Report: This answers the question, “How does traffic reach your website?” Your traffic is classified into four categories: organic search, direct, referral, and social media. This report teaches you what type of SEO activity prioritize.
- Behavior Report: Next up, this report will show you what your visitors are doing on your website. With this, you’ll be able to note patterns and your top-performing pages. For instance, this also includes analyzing Site Content. And this works by reporting the performance of various content on your page.
- Conversion Report: Lastly, this specific report shows how your website’s conversion rate is performing. If you’re running an online store, this will show you your individual product performance to improve your purchases and further boost these rates.
Let’s wrap up this overview!
Google Analytics has an abundance of distinct benefits.
It gives you quick website insights, customized reports, and easy analysis of your desired metrics.
You get to extensively study your market. And you can even see what works and what doesn’t in order to boost your traffic.
It takes a lot of getting used to but once you get the hang of it, these analytics will guide the improvement of your business as a whole.
If you’re looking to boost your SEO strategies based on your analytics, you can check deepconnex’s services here.
What are your thoughts on Google Analytics? How do you make the most out of it? Share your thoughts with us!
Subscribe to our newsletter now!
Receive weekly blogs and updates.
RELATED BLOGS

7 Digital Marketing Trends This 2022
With technology, the present is now the future. New innovations are developing each day. Cryptocurrency, non-fungible tokens (NFTs), and the Metaverse are starting to shape our online universe. Digital marketing is also becoming bigger than ever. New digital marketing methods are being developed. It’s becoming easier and faster to market your business online. If you’re […]
Jigger
September 9, 2022

The Metaverse & The Future of Digital Marketing
Metaverse, virtual reality, virtual people, literally anything virtual– it’s like we’re in another world and this is truly the future. We all know that the Metaverse is such an advanced area of technology where you can do all the things that you’d do in reality. Although the big question always comes to mind, “What does […]
Alejandra
August 31, 2022
RELATED BLOGS
7 Digital Marketing Trends This 2022
With technology, the present is now the future. New innovations are developing each day. Cryptocurrency, non-fungible tokens (NFTs), and the Metaverse are starting to shape our online universe. Digital marketing is also becoming bigger than ever. New digital marketing methods are being developed. It’s becoming easier and faster to market your business online. If you’re […]
Jigger
September 9, 2022
The Metaverse & The Future of Digital Marketing
Metaverse, virtual reality, virtual people, literally anything virtual– it’s like we’re in another world and this is truly the future. We all know that the Metaverse is such an advanced area of technology where you can do all the things that you’d do in reality. Although the big question always comes to mind, “What does […]
Alejandra
August 31, 2022